Abstract
Background and aims: Post-stroke fatigue (PSF) can independently predict mortality in stroke patients. The effect of PSF on the process of exercise and its nature remains unclear. This study aimed to investigate how motor performance and cortical activity differ between stroke patients with high versus low post-stroke fatigue during exercise.
Materials and Methods: 18 informed patients completed the trial, with 8 individuals in the high PSF group (HFG) and 10 individuals in the low PSF group (LFG). Maximum voluntary contraction was measured using surface electromyogram (sEMG), each participant underwent a fatigue-inducing isometric knee-extension task at 70% maximum voluntary contraction. Cortical neural activity in cortical regions of interest was assessed using near-infrared functional imaging system (fNIRS), while muscle activity was monitored with sEMG. Primary outcomes included the number of knee-extensions performed, and changes in oxygenated hemoglobin (HbO2) in the regions of interest.
Results: No significant difference was observed in the number of knee-extensions between groups (P=0.11). However, significant group differences were found in HbO2 concentration of the right primary motor cortex (P=0.01) and left primary somatosensory cortex (P=0.01). A time effect revealed an increase in HbO2 concentration in the left frontal eye field (P=0.04). MPF values significantly correlated with HbO2 concentration changes in left frontal eye field for both groups (HFG, P=0.01; LFG, P=0.047).
Conclusions: The endurance of patients in LFG and HFG after stroke is comparable. Patients with high PSF have the characteristics of increased neural activity in the left primary somatosensory cortex and the right primary motor cortex during exercise.
1.Introduction
Fatigue is a common symptom of numerous neurological diseases, including stroke.[1] Post-stroke fatigue (PSF), with incidence as high as 85%, can independently predict hospitalization, functional independence and mortality in stroke patients.[2-3] Even among those who developed satisfactory recovery with the aspect of neurological and mental function, PSF could be recognized as their only remaining dysfunction.[4] The characteristics of PSF have been described as having an extreme lack of energy, unexplained exhaustion and frequent rest requirement, which can not necessarily relieve the fatigue.[5-6] Furthermore, this negative impact can manifest in multidimensional processes including motor, cognition, and mental activities,[7] and even persist chronically.[8-9] Exploration of contributing factors behind this complex condition, however, has shown that the severity, duration, and frequency of stroke are not significantly correlate with occurrence of PSF.[10] Furthermore, post-stroke depression and dyssomnia, which often overlap with PSF, are also mutually independent from PSF.[3] In other words, little is known about mechanism underlying PSF and thus drawing ever increasing attention worldwide.
Since the central nervous system contributes to fatigue during exercise in healthy subjects, PSF as a symptom following central nervous system injuries might also involve pathological changes in central factors. Research has explored the activity of central nervous system in patients with PSF during rest or low-intensity activities, indicating that lower motor cortex excitability, abnormal regulation of sensory-motor neural pathways, and the interaction inhibition advantage transformation between hemispheres are all characteristics for high fatigue groups after stroke.[11-12] Nevertheless, extensive deterioration of daily activity appears to be the main consequence of PSF in stroke patients,[2] which makes exploration on change of central factors during exercise or even fatigue-inducing activities in PSF patients a more pressing issue to be addressed.[13] Although previous studies have shown no correlation between walking intensity and PSF,[14-15] chronic fatigue and exertional fatigue are two distinct constructs.[16] Understanding how PSF affects activity processes and the nature of it are still unclear but crucial for patients and clinicians to manage this symptom effectively.
Compared to previously used neurological imaging systems when detecting mechanics of PSF, such as fMRI, portable fNIRS could enable data collection of cortical activity during movements and reflect event-related activity change of multiple cortical regions of interest in real time, benefiting from its high temporal resolution.[17-18] Mean Power Frequency (MPF), index of frequency domain analysis, typically serves as indicator of muscle fatigue,[19] and partially represents the result of synchronization among motor units determined by central factors.[20]
The purpose of this study is to comprehensively observe the motor performance and corresponding cortical activity of stroke patients with different levels of PSF, which can help clarify the characteristics of high PSF patients during exercise, aiding in the exploration of possible pathological mechanisms underlying abnormal fatigue among the stroke population. This article is derived in part from the first author’s master dissertation[21] awarded by Guangzhou Sport University in 2024.
2.Methods
A cross-sectional observational design was adopted in this research. All subjects were grouped based on their PSF level, evaluated through the Fatigue Severity Scale (FSS),[22-23] into High Fatigue Group (HFG) (≥4) and Low Fatigue Group (LFG) (<4) after screening and enrollment[24], and completed the following steps of the study as illustrated in the flowchart (Figure 1). The FSS is a 9-item self-report questionnaire that has been extensively validated in stroke populations, with previous studies demonstrating its reliability (Cronbach's α = 0.89-0.94) and validity for assessing post-stroke fatigue. The cutoff score of ≥4 (mean score across 9 items) has been established as clinically significant fatigue in stroke patients, showing good sensitivity and specificity for identifying patients with meaningful fatigue symptoms that impact daily functioning. All participants were uninformed about group assignments, and the researchers who evaluated the FSS scores for each participant were unaware of the subsequent steps of the experiment to avoid observer and response bias. All participants were uninformed about group assignments, and the researchers who evaluated the FSS scores for each participant were unaware of the subsequent steps of the experiment to avoid observer and response bias. This study was approved by the Ethics Committee of the Third Affiliated Hospital of Sun Yat-sen University (ethics approval number: RG2023-077-01), and all the subjects have signed an informed consent in compliance with the Declaration of Helsinki.
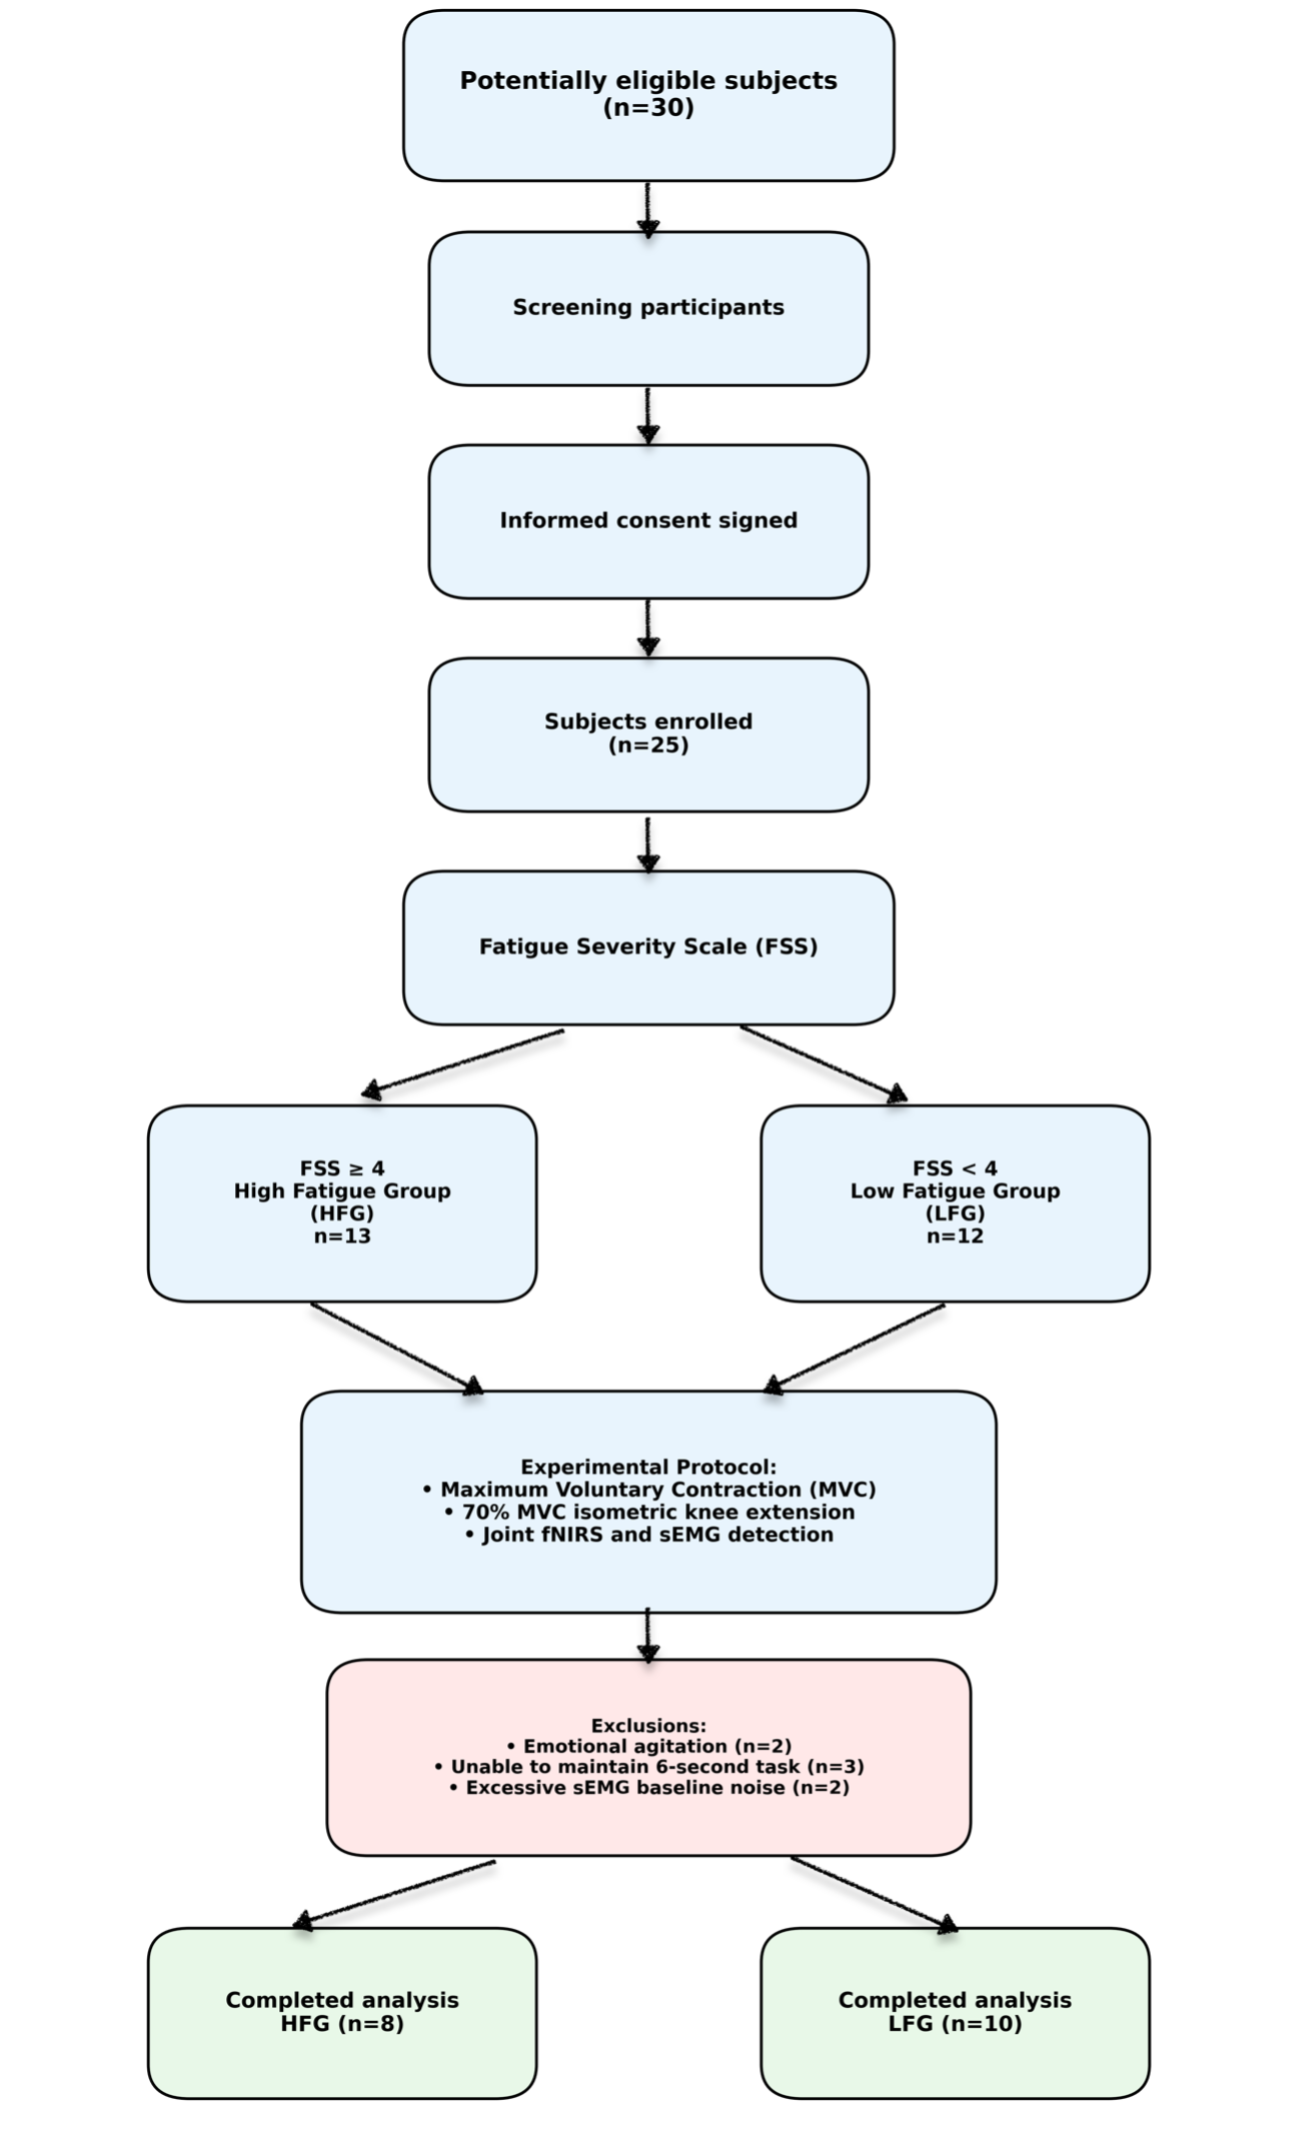
Figure 1. Flowchart of Study Design: Enrollment, Grouping, and Outcome Measurements
2.1.Subjects
All subjects were enrolled from the Rehabilitation Department of the Third Affiliated Hospital of Sun Yat-Sen University between May to June 2023 according to the following inclusion and exclusion criteria:
2.1.1.Inclusion criteria:
(1) Diagnosed as cerebral infarction or hemorrhage for the first time.[25-26]
(2) Age of subjects≥18 years old.
(3) Hospital Anxiety and Depression Scale≤11.[27]
(4) Score on the Chinese version of the Montreal Cognitive Assessment≥23 to ensure sufficient cognitive function for understanding and executing simple instructions.[28]
(5) Manual Muscle Test (MMT) for the knee extensor of the affected lower extremity ≥3, indicating that the patient can complete the full range of motion in knee extension in the anti-gravity position.[29]
2.1.2.Exclusion criteria:
(1) Use of medicine acting on the central nervous system that might induce fatigue.
(2) Skeletal-muscular diseases, such as fractures, affect lower extremity exercises.
(3) Organic diseases significantly causing fatigue such as coronary heart disease or chronic renal insufficiency.
(4) Skull defect or post-skull repair surgery.
(5) Significant pain, visual analog pain scale>6.[30]
2.2. Sample Size Calculation:
The sample size was calculated using SPSS software version 27, with a confidence level of 95% and a two-sided significance level of 0.05. Based on the results of pilot study, the estimated total sample size for the two groups was 10 participants. With a statistical power (1-β) of 0.8 and a significance level (α) of 0.05, at least 20 samples were required. Considering potential clinical dropouts, 25 patients were ultimately recruited for this study. Although the final analyzed sample size (n=18) was slightly below the calculated requirement of 20 participants due to dropouts and data quality issues, post-hoc power analysis confirmed adequate statistical power (>0.75) for detecting the observed effect sizes in the primary outcomes, particularly for the significant group differences in cortical activity measures.
2.3. Sampling strategy
In the stratified random sampling of this experiment, gender and age were used as key variables, with gender divided into male and female, and age divided into over 60 years old and under 60 years old. Within each stratum, random number tables were used for random sampling until 10 participants were collected in each group.
2.4. Equipment and software
(1) sEMG data collection and analysis system FREEEMG1000(BTS, Italy) was chosen to detect the electrical activity of rectus femoris during dynamic knee-extension.[31]
(2) An fNIRS optical imaging system, NirSmart-6000A ((Danyang Huichuang Medical Equipment Co., Ltd., China) was adopted to continuously measure and record cortical activity-related concentration changes of brain oxygenated hemoglobin (HbO2) during the task. The system consists of a near-infrared light source and an avalanche photodiode as detectors, with wavelengths of 730nm and 850nm. This experiment adopted imaging system containing 27 optrodes with 13 light resources and 14 detectors, allowing the simultaneous recording of 42 channels. Each optrode was placed on specific region of interest to form a channel between adjacent one light source and one detector, numbered from 1 to 42. The sampling rate of NirSmart-6000A was 11 Hz. The positioning of optrodes was based on the international 10–20 system to provide region-location information of each channel,[32] with the Cz (cranial vertex) located beneath the second light resource, between the 5th and 8th channels, and the 6th and 7th channels. The optrodes were secured with the average inter-optrode distance of 3cm on the skull using a holder cap made of thermoplastic resin. The cortical activity represented by HbO2 was then recorded in preselected regions of interest, including the primary somatosensory cortex (S1), somatosensory association cortex, primary motor cortex (M1), pre-motor and supplementary motor cortex (PMC and SMA), frontal eye field, and dorsolateral prefrontal cortex (DLPFC).
2.5. Preparation and setting
As shown in Figure 2A, before the test, subjects sat on a chair with their entire thigh in contact with the seat and their arms crossed in front of their chest. The skin of the affected femur had undergone hair removal, skin grinding, and cleaning with isopropanol alcohol to ensure low skin impedance (<5 k Ω). According to SENIAM recommendations[33], electrodes were placed on the affected side of the rectus femoris muscle. The head cap of the fNIRS system was placed in accordance with standards that the frontal edge overlaps the eyebrow bone, and Cz point was positioned at the intersection point of nasal root-occipital tuberosity connection and the two ear screens connection. Each optrode was adjusted to sufficiently contact the scalp to acquire suitable data intensity.
2.6. Procedure
This research was conducted in the following two steps. Step one: The maximum voluntary contraction was measured using the sEMG data collection system (FREEEMG1000, BTS, Italy) as the subjects exerted maximum effort to ensure that the signals from the affected knee extensor on the real-time feedback interface (as shown in Figure 2B) were as high as possible. The maximum muscle activity tested was recorded as maximum voluntary contraction. Step two: Fatigue-inducing isometric knee-extension test was performed under simultaneous detection by sEMG and fNIRS. After the maximum voluntary contraction test, 70% of maximum voluntary contraction[34] was automatically labeled on the screen as the target of isometric exercise seen in Figure 2C. As demonstrated in Figure 2D, every subject was required to follow two voice prompts set up with fixed time interval in NirSpark (Version 1.8.1, Danyang Huichuang Medical Equipment Co., Ltd., China) implemented in the MATLAB environment (MathWorks, Natick, MA, USA). This formed a unit with the sequence as “rest” (15 seconds), “knee-extension” (6 seconds). The circulation of this unit would cease at the point of the last "rest" when the subject could no longer continuously hold knee extension during a 6-second contraction above the target level for two consecutive attempts.[35] During the isometric exercise, the operator was allowed to encourage the subject to hold the knee extension as long as possible, collecting the number of extensions and the rating of perceived exertion using the Borg Rating of Perceived Exertion Scale(RPE)[36] for each subject before and immediately after the isometric exercise.
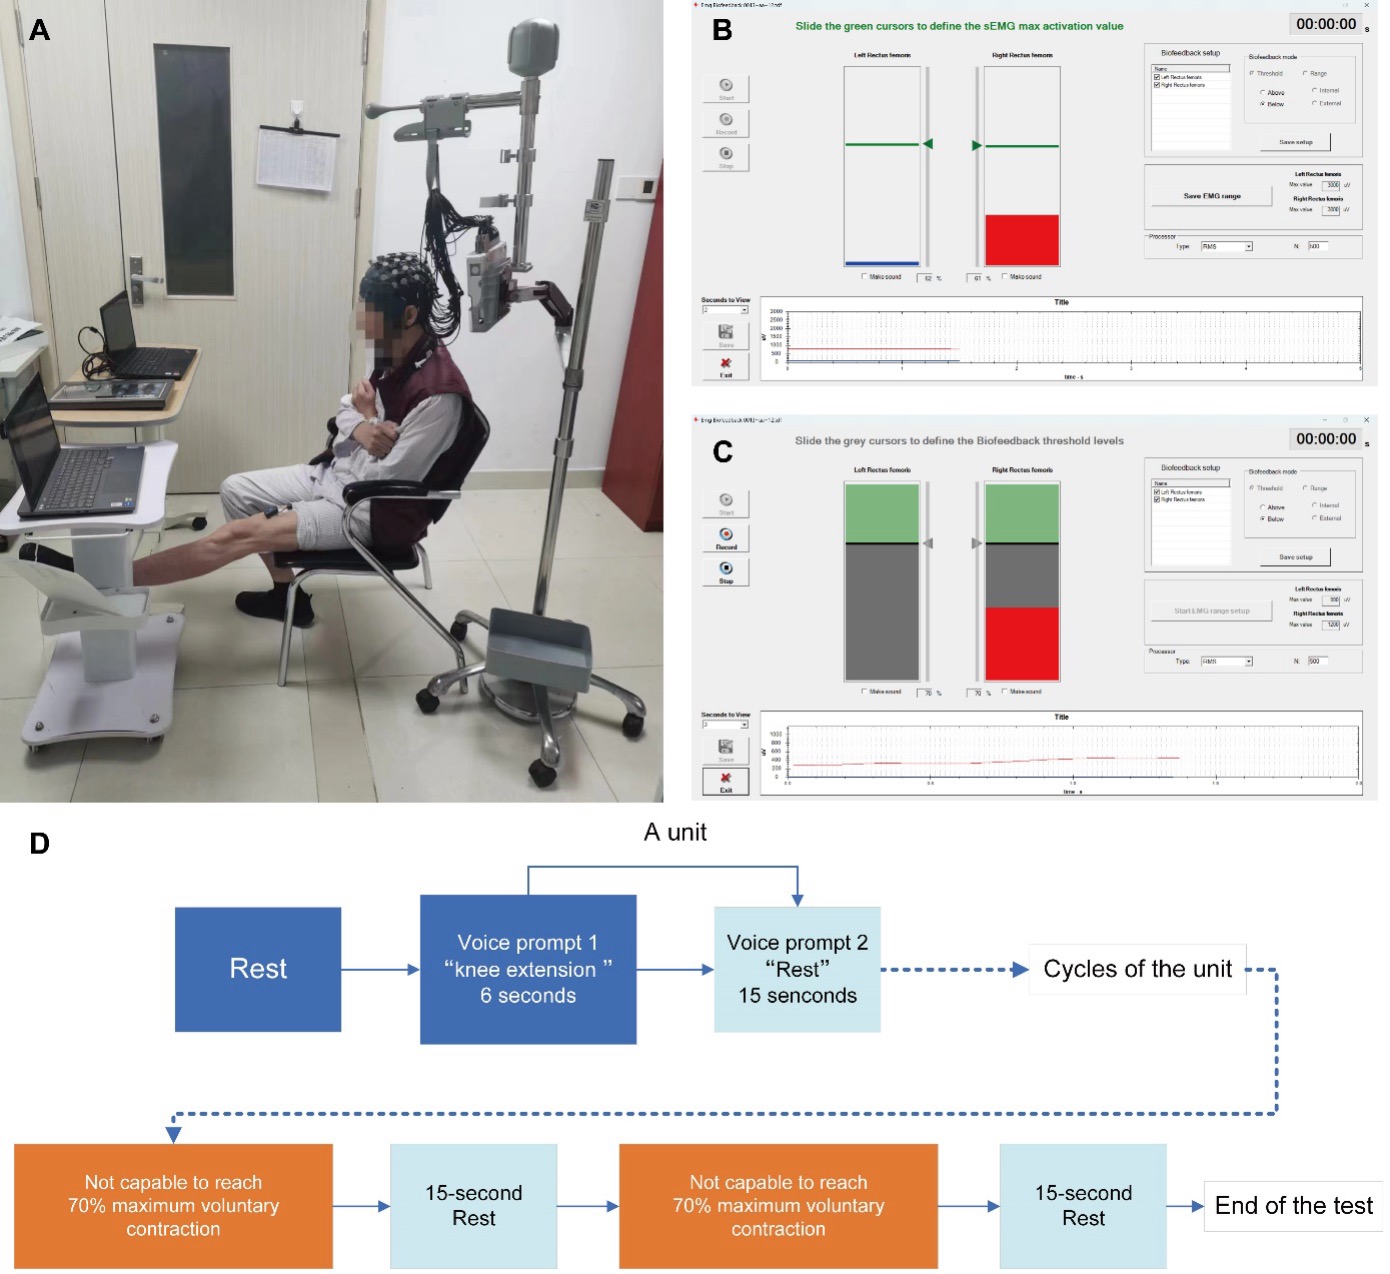
Figure 2. Experimental setup and procedures for fatigue-inducing isometric knee extension. (A) Participant positioning with fNIRS cap placement and surface EMG electrodes on the affected rectus femoris muscle. Participants sat with arms crossed and full thigh contact with the chair seat. (B) Real-time interface for measuring maximum voluntary contraction (MVC) of the rectus femoris muscle, showing EMG amplitude feedback (red area indicates target achievement). (C) Real-time electromyographic feedback interface during isometric knee extension at 70% MVC. Green areas indicate successful target maintenance, while red areas show target achievement during 6-second contractions. (D) Experimental protocol timeline showing alternating rest (15 seconds) and knee-extension (6 seconds) cycles. Termination occurred when participants failed to maintain 70% MVC for two consecutive 6-second contractions. fNIRS data were collected continuously throughout the protocol.
2.7. Data collection and processing
(1) Concentration of HbO2 in the cortical regions of interest: The optical imaging data from sensors of fNIRS were normalized to a standard stereotaxic space. Signal processing and data analysis were completed by NirSpark. The total duration each subject took to perform knee-extensions until failure was evenly divided into 3 intervals, among which light intensity signal of the first and last 1/3 intervals were preconditioned of the following steps. Step one: import documents containing the original signals and files recording the locations of optrodes into Nirspark to receive data with time marks corresponding to the experimental conditions; Step two: examine and delete any obviously erroneous data, screen out undesired segments and remove signal artifacts and drift caused by motion, breathing or heartbeat. Filter the signals with band pass frequency from 0.01 to 0.2Hz; Step three: transfer the light intensity signal into concentration value of HbO2 according to Bill Lambert's law. Superpose HbO2 concentration of every rest-knee-extension cycle within first or last 1/3 interval, and then average the result. Calculate the difference between the maximum value during the 2nd to 6th seconds after the prompt for knee-extension and 5 seconds baseline value before the order as the index representing neural activity level of specific areas.
(2) MPF Values of sEMG Signals: firstly, the sEMG signal with a bandwidth frequency of 0.3Hz to 1kHz was amplified at a sampling frequency of 2kHz. The filtered signal was then rectified in full wave and the non-rising phase during contraction was calculated and subtracted from the resting muscle signal within 250ms before each contraction. The MPF value of the designated segment during each contraction within the first or last 1/3 interval was averaged and the difference between last 1/3 interval and first 1/3 interval was taken as the outcome of muscle fatigue.[37]
2.8. Statistical analysis
SPSS v.27 was adopted for the statistical analysis of the data. The normality of all continuous variables was examined using the Shapiro-Wilk test. Variables that completed with normal distribution were expressed as mean ± standard deviation, whereas variables with nonnormal distribution were tested using Wilcoxon test and expressed by median (25th percentile, 75th percentile).
Observations that contained missing values were deleted, and only the samples with complete data were retained. The number of repetitions between groups were examined using two independent t-test. Repeated measures Analysis of Variance (ANOVA) was utilized to calculate RPE scores of patients in the two groups before and after exercise. Additionally, changes in RPE scores for patients in HFG were tested by paired t-test, while the Wilcoxon test was used for the LFG. Comparison of MPF at two time points (MPF of first and last 1/3 interval, and two group levels (LFG and HFG) were also completed via repeated measures ANOVA, within group differences of two variables tested by paired t-test. Variation in HbO2 concentration in blood flow of the regions of interest was examined after transformation of time and groups (first and last 1/3 intervals, LFG and HFG) by repeated measures ANOVA. All significant results obtained through ANOVA were corrected by the Bonferroni test in post hoc analysis.[38] Pearson correlation test was used to examine the relationship between the difference of MPF and difference of HbO2 concentration in corresponding time intervals. The significant level was set at p<0.05.
3.Results
3.1.General information
Table 1. General information of all subjects
|
|
Low fatigue group |
High fatigue group |
p |
|
Gender (male/female) |
8/2 |
7/1 |
0.671 |
|
Age (year) |
60.7±13.96 |
56.56±10.17 |
0.474 |
|
3±2.11 |
7.44±7.2 |
0.107 |
|
|
Stroke type (ischemic/hemorrhage) |
8/2 |
6/2 |
0.522 |
|
Hemiplegic side (right/left) |
4/6 |
5/3 |
0.343 |
3.2.Comparison of knee-extension repetitions and RPE scores between low and high fatigue groups
No significant difference (p=0.11) was found when comparing the number of knee-extension repetitions between groups (LFG: 27.5±17.11, HFG: 15.67±9.22). Repeated-measures ANOVA revealed no significant time × group interaction effect for RPE scores ( p = 0.9), whereas a significant main effect of time was observed (p < .001). The main effect of group was not statistically significant (p = 0.5). When scores of RPE of patients in both fatigue groups were compared before (LFG 10.1(9.25,11.25), HFG 9.5(5.25,13.75)) and after exercise (LFG 12.6(10.0,15.5), HFG 12(10.5,13.5)), significant increase were illustrated in LFG (p=0.02) and HFG (p=0.02) after Bonferroni correction (as shown in Figure 3).
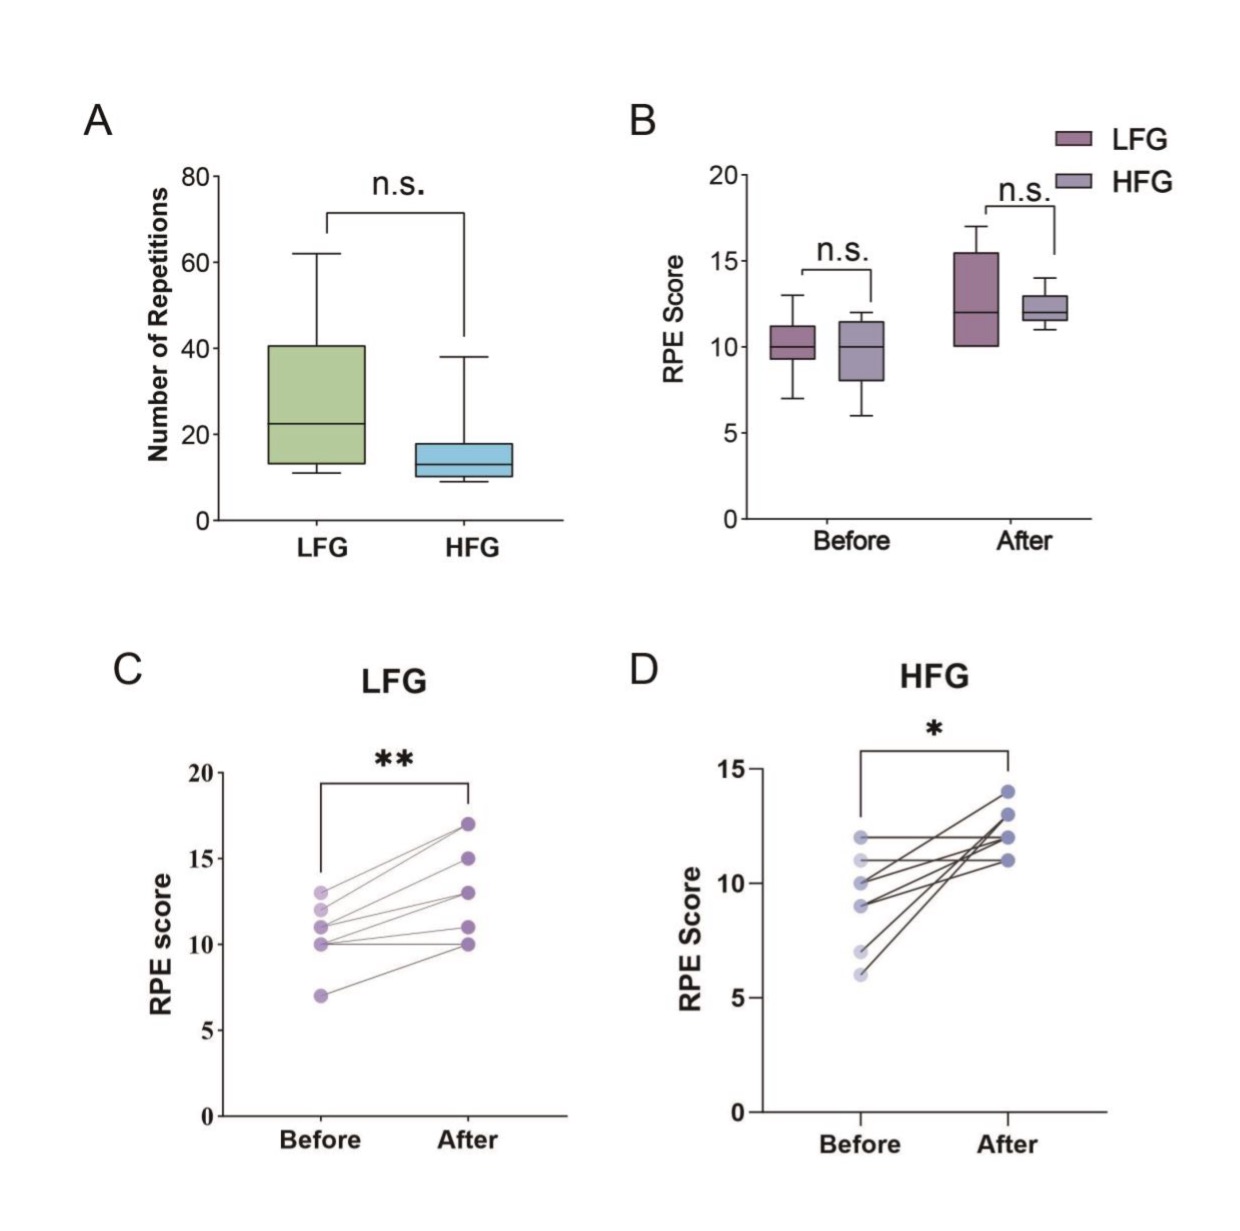
Figure 3. Motor performance and perceived exertion outcomes. (A) Comparison of the number of knee-extension repetitions performed until failure between Low Fatigue Group (LFG, n=10) and High Fatigue Group (HFG, n=8). No significant difference was observed (P=0.11). (B) Repeated measures ANOVA of Rating of Perceived Exertion (RPE) scores between the two groups before and after isometric knee-extension exercise. Both groups showed significant increases in RPE post-exercise. (C) Within-group comparison of RPE scores before and after exercise in LFG showing significant increase (*P=0.02). (D) Within-group comparison of RPE scores before and after exercise in HFG showing significant increase (*P=0.02). Error bars represent standard error of the mean. n.s. = not significant; *P<0.05; **P<0.01.
3.3.Comparison of HbO2 concentration of cortical regions of interest between LFG and HFG in the first and last 1/3 intervals.
The result of repeated measure ANOVA of HbO2 concentration in the interested cortex of two groups showed no significant time × group interaction in the first and last 1/3-time interval. However, a significant main effect of time on HbO₂ concentration changes was observed at Channel 24 (localized to the left frontal eye field) (F=4.89, P=0.04), indicating significantly enhanced neural activity in this region with prolonged exercise duration, as shown in Figure 4A. Within each group, there were no significant changes in HbO2 concentration of every channel. Significant group main effect could be shown in right M1(10th channel, P=0.01) and left S1 (26th channel, p=0.01), and p values calculated after post hoc analysis were adopted to plot the result as illustrated in Figure 4B.
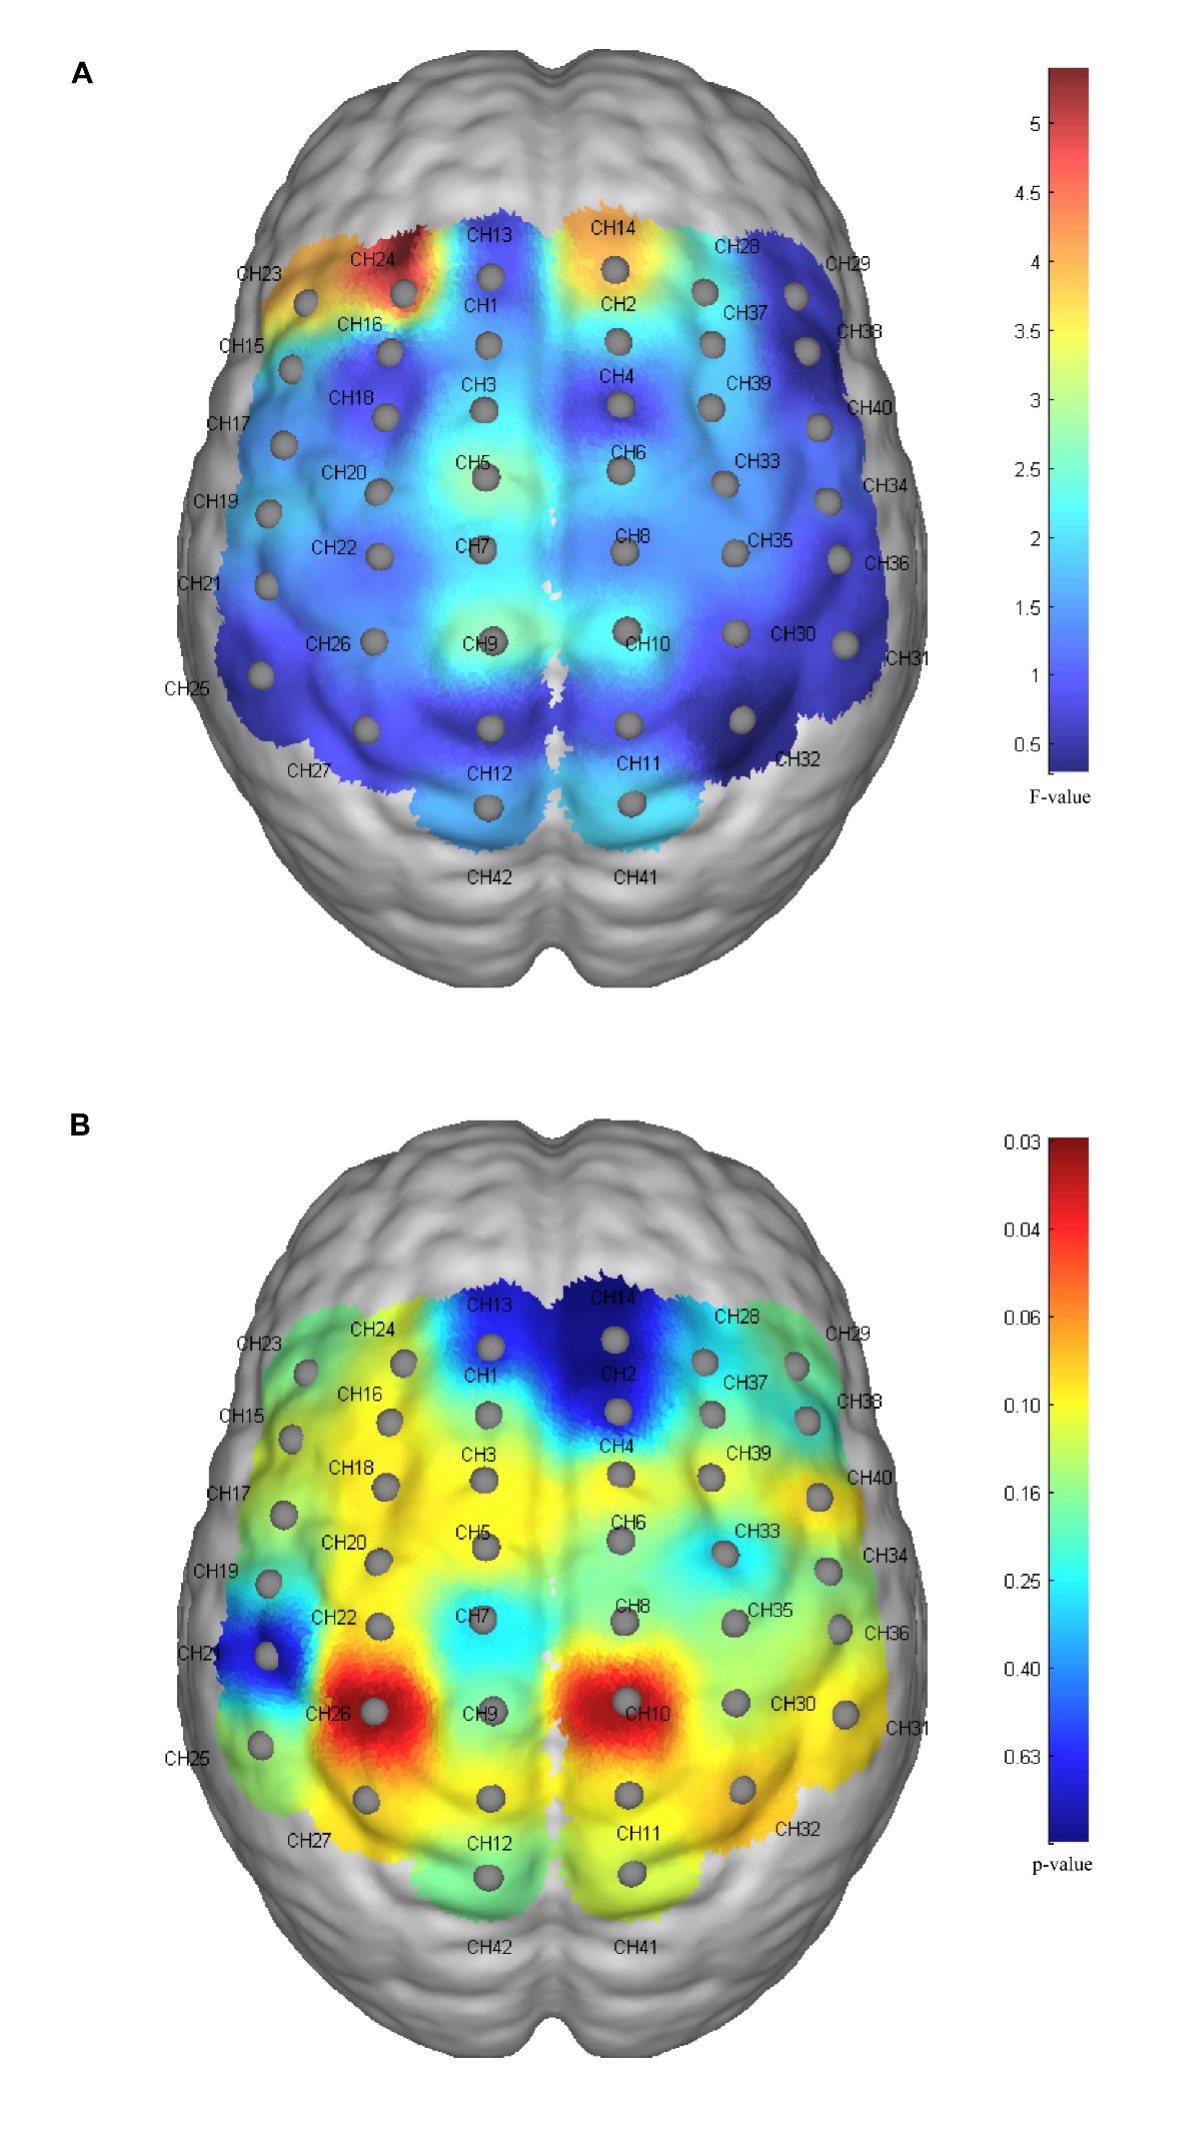
Figure 4. fNIRS cortical activation mapping during fatigue-inducing exercise. Repeated-measures ANOVA statistical maps across 42 fNIRS channels showing cortical oxygenated hemoglobin (HbO2) concentration changes. Channel positions are based on the international 10-20 system with specific cortical regions: primary motor cortex (M1, channels 9-11), primary somatosensory cortex (S1, channels 25-27), frontal eye field (FEF, channel 24), and dorsolateral prefrontal cortex (DLPFC, channels 1-3). (A) Time main effect mapping (F-values) showing significant activation increase over exercise duration. Warmer colors (red, F>4.0) indicate stronger time-related effects, with significant activation observed in left frontal eye field (channel 24, F=4.89, P=0.04). Cooler colors (blue, F<2.0) represent minimal time effects. (B) Group main effect mapping (p-values) comparing High Fatigue Group (HFG, n=8) versus Low Fatigue Group (LFG, n=10). Warmer colors (red, P<0.05) indicate significant group differences, with HFG showing greater activation in right primary motor cortex (channel 10, P=0.01) and left primary somatosensory cortex (channel 26, P=0.01). Cooler colors (blue, P>0.4) represent non-significant group differences.
3.4. Comparison of MPF of sEMG signal of affected rectus femoris for stroke patients in LFG vs HFG
The analysis of the MPF for the two groups in the first and last 1/3 interval of exercise process revealed no significant time × group interaction effect (p=0.83), time main effect (p=0.26), or group main effect (p=0.11). Within each group, the average MPF in the last 1/3 interval (LFG 78.05±9.46, HFG 71.55±12.33) was significantly reduced compared to the first 1/3 interval (LFG 81.24±10.02, HFG 76.23±10.85) after Bonferroni correction showing significance for both LFG (p=0.04) and HFG (p=0.03).
3.5. Correlation analysis between HbO2 concentration of cortical regions of interest and MPF in LFG and HFG
As shown in Figure 5, the MPF value difference obtained by subtracting the average MPF in the first 1/3 time interval from that in the last 1/3 time interval (HFG -5.22±4.39, LFG -3.1±4.28) were significantly correlated with the HbO2 concentration difference (HFG 0.03±0.04, LFG 0.03±0.04) between the last and first 1/3 interval in blood flow of the left frontal eye field represented by 24th channel (HFG p=0.01, LFG p=0.047). The MPF difference in both groups had no significant correlation with the HbO2 concentration difference (HFG 0.04±0.08, LFG 0.02±0.06) between the first and last 1/3 time interval in the blood flow of left S1 corresponding to channel 26. There was no significant correlation between the MPF and the HbO2 concentration difference (HFG 0.06±0.05, LFG 0.04±0.06) in the blood flow of right M1.
Figure 5. Correlation analysis between muscle fatigue and cortical activation changes. Scatter plots showing the relationship between Mean Power Frequency (MPF) difference (last 1/3 interval minus first 1/3 interval) and HbO2 concentration difference (last 1/3 interval minus first 1/3 interval) in specific cortical regions for Low Fatigue Group (LFG, n=10, panels A-C) and High Fatigue Group (HFG, n=8, panels D-F). (A,D) Left frontal eye field (channel 24): Significant negative correlations observed in both LFG (r=-0.687, P=0.047) and HFG (r=-0.833, P=0.01), with stronger correlation in HFG. (B,E) Right primary motor cortex (channel 10): Non-significant correlations in both groups (LFG: r=-0.173, P=0.632; HFG: r=-0.066, P=0.876). (C,F) Left primary somatosensory cortex (channel 26): Non-significant correlations in both groups (LFG: r=-0.000, P=0.999; HFG: r=-0.516, P=0.190). Negative MPF differences indicate muscle fatigue development; positive HbO2 differences indicate increased cortical activation. Trend lines show linear regression fits.
4. Discussion
This is the first study currently known to examine the effect of PSF on patients with stroke during exercise with simultaneous detection of central neural activity and muscle activity. It yields three principal conclusions. Firstly, the number of repetitions and the alterations in the RPE score before and after intermitted isometric exercise were statistically comparable between the two groups. Secondly, subjects in HFG exhibited significantly greater activity in the right M1 and left S1 compared to those in LFG. Moreover, neural activity in the left frontal eye field was significantly enhanced for both groups as the duration of exercise increased. Thirdly, both groups experienced a marked escalation in muscle fatigue, with the magnitude of this increase being equivalent across groups post-exercise. Furthermore, the degree of muscle fatigue was significantly correlated with neural activity in the left frontal eye field for both groups.
4.1. Motor performance of stroke patients with different PSF levels
Since there was no significant difference in repetitions between groups until failure to continue isometric knee extension, a high PSF level did not cause a significant decrease in the total amount of exercise performed. This finding is consistent with previous conclusions: fatigue severity is not related with indices representing exercise capacity, such as walking intensity[14-15] and maximum oxygen uptake for stroke patients.[39] This conclusion could help explain why graded exercise has no direct effect when targeting the symptom of PSF but could only improve the complications accompanying PSF indirectly.[40] Furthermore, the RPE score, as an index representing the immediate exertion level acquired before and after exercise of all subjects, showed no difference between LFG and HFG. This finding illustrates the independence of exertion fatigue from PSF aligns with earlier research.[16] It can be inferred from this that the requirement on the total amount of exercise for stroke patients with high PSF shall not be reduced solely due to the obvious sense of fatigue. This result lays the scientific foundation when persuading patients with high PSF to persist on rehabilitation training, which can help to avoid the deconditioning effect on musculoskeletal and cardiopulmonary systems caused by a sedentary lifestyle after stroke.[41] Besides, This disease characteristic should be communicated to care givers and families of patients to enhance their comprehension of the patients’ conditions, thereby easing their anxiety and depression.[42]
4.2. Difference of neural activity of S1 between LFG and HFG during exercise
During the process of intermitted isometric knee-extension until muscle fatigue, significant increased neural activity of S1 was observed in HFG compared to LFG. S1 is the area responsible for recognition and discrimination of sensory signals ascending from peripheral sensors located in muscles, joints, and skin.[43] Therefore, enhanced neural activity of S1 in HFG could represent higher intensity of sensory signal recognized from peripheral sensors while exercising. Previous study has similar conclusion that PSF formation is significantly related to abnormal perceived exertion.[11] This conclusion suggests that patients with high PSF have significantly enhanced sensory recognition and discrimination during exercise. Sensory perceptions of human to the self-generated actions conform to the theory known as the predictive coding framework.[44] When one action generated, the intensity of sensory signal is reduced if the prediction of action matches the feedback, allowing more focus added to the unexpected external stimuli. This inability to naturally reduce signal intensity of feedback might be the reason for higher fatigue perceived during similar exercise for patients with high PSF after stroke.[45-47] More research should be designed to verify this theory.
4.3. Difference of neural activity of M1 between LFG and HFG during exercise
In comparison with patients in LFG, the right M1 was also the area where patients in HFG exhibited higher neural activity during exercise. The advantage of the right M1 over the left M1 during reciprocal inhibition between hemispheres accounts for the high PSF, as illustrated in previous research.[1] The finding of this study indicates that patients in HFG showing higher activity in the right M1 but not the left M1, aligning with this conclusion. The right hemisphere plays a stronger role in processing sympathetic information, which explains the intensity of peripheral sensory signals cannot be naturally reduced during exercise for patients with stroke, leading to high PSF.[48] Right M1 but not left M1 could be one of the regions of interest to address PSF. However, it had been found that lower excitability of M1 is the characteristic for patients with high PSF during low-intensity exercise.[12] This conflicting phenomenon maybe be due to varied intensity of exercise being underpinned by different cortex activation patterns. Patients with other neurological conditions, such as multiple multiple sclerosis or chronic fatigue syndrome, exhibit fatigue symptoms, showing similar variable activation pattern of neural activity,[49-50] which suggests that intensity of exercise should be treated as an important factor when examining neural activation pattern of patients with PSF. Furthermore, 77% of HbO2 concentration variation in the relevant cortex could be attributed to enhanced cortical excitability,[51] which suggest the possibility that overactive inhibitory neurons within M1 may play a role in higher blood flow in this area.[52] It has been demonstrated that disconnection between the motor cortex and sub-cortical structures is significantly related to fatigue symptoms in patients with multiple scoliosis.[53] If such disconnection occurs in patients with stroke, excessive inhibition within M1 could exist due to the enhanced activity of inhibitory neurons,[54] which might also one of explanations about higher M1 activity in HFG.
4.4. Neural activity of frontal eye field in LFG and HFG
After the temporal evolution of exercise, all subjects with stroke exhibited a significant increase in neural activity of left frontal eye field. The frontal lobe receives multiple sensory stimuli, including information from somatosensory and visual cortices. It is also responsible for evaluating the magnitude and potential negative consequences of these stimuli to form compensatory mechanisms for current states.[55] This result may suggest a potential regulatory role of left frontal eye field during the intermittent isometric exercise across different PSF levels, though the precise mechanisms require further investigation. Previous research has shown that when healthy individuals strive to reach exercise targets, the frontal lobe can enhance M1 output through the pathway: "basal ganglia - thalamus - frontal lobe - premotor area".[56] In contrast, neuroimaging studies have demonstrated that patients with high PSF have altered connectivity patterns among left frontal lobe, left medial and lateral cingulate gyrus, and left supplementary motor area.[9] Furthermore, clinical evidence indicates that cognitive therapy, rather than graded exercise, can directly address fatigue symptoms in patients with stroke.[57] Based on these findings and our observations, we hypothesize that the enhanced neural activity of left frontal eye field in our subjects might reflect increased evaluative processing of sensory signals, potentially contributing to M1 excitation through the aforementioned pathway, though this interpretation remains speculative and warrants future mechanistic studies.
4.5. MPF difference between groups and the relationship of MPF with neural activity of left frontal eye field
Compared to other detected cortices, the left frontal eye field was the only one discovered notably correlated with muscle fatigue degree in both groups, with a more prominent interrelation observed in HFG. Although the outcomes have exhibited an equivalent extent of muscle fatigue between patients in both groups, the tighter connection in HFG suggests that greater neural activity in the left frontal eye field may be associated with similar peripheral muscle firing frequency shifts. Previous studies have established a significant correlation between increased sense of fatigue and decreased MPF of muscle.[58] Based on this evidence and our findings, we tentatively propose that more intensive evaluation and decision-making processes may occur in the left frontal lobe of patients in HFG to potentially counterbalance the altered signals from S1, though this mechanistic interpretation requires validation through future targeted studies. This regulatory process could also explain why there are comparable numbers of knee-extension and muscle electrical activity despite the different performances of S1 and M1 observed in LFG and HFG. Jointly neural stimulation of left frontal lobe and S1 or solely S1 depending on intensity of exercise might be one of the directions to address high PSF.
4.6. Limitations
Although the cross-sectional design of study provides the foundation for researchers to explore mechanisms impinging PSF. However, the causality between abnormal cortical activity and high PSF cannot be affirmed with this design. Future research should investigate causal factors of PSF based on the result of this study, for example, the effect of intervention on right M1 or left S1 on PSF severity and related motor performance for patients with stroke. Furthermore, sample size of this study is still relatively low. Bias of basic information in patients in LFG and HFG including gender, stroke type can exist although there are no significant differences. The study did not systematically quantify the heterogeneity of stroke lesions, including the specific location of cerebral infarction and affected vascular territories, or sensorimotor compensatory mechanisms. These factors may influence cerebral blood flow patterns and brain function, thereby potentially introducing confounding interference in the neural attribution of exercise-related fatigue and affecting the validity of our conclusions. Future studies should include detailed neuroimaging assessment to document the specific anatomical location of stroke lesions and identify the affected vascular territories to better understand their potential impact on cortical activation patterns during exercise. More participants should be recruited in the following research to increase the confidence of the result.
5. Conclusions
It can be concluded that motor performance of patients in HFG is comparable to that in LFG. During exercise, enhanced neural activity of left S1 and right M1 are the characteristics of patients in HFG compared to those in LFG. The left frontal eye field is significantly activated during the process of reaching muscle fatigue for all subjects and is related with the extent of muscle fatigue in both groups. The correlation is more prominent for patients in HFG.
quarterly,launched in March 2025
Editor-in-Chief: Limin Rong
Sponsor: Sun Yat-sen University
Publisher: Sun Yat-sen University Press
Co-Publisher: KeAi Communications Co., Ltd.
Edited by: Editorial Office of Journal of Brain and Spine
Address: 600 Tianhe Road, Guangzhou, 510630, China
Website: http://jbs.sypub.cn/jbs
E-mail: jbseditor@mail.sysu.edu.cn

Address:600 Tianhe Road, Guangzhou, 510630, China
Website:http://jbs.sypub.cn/jbs
E-mail:jbseditor@mail.sysu.edu.cn